- by x32x01 ||
Reverse engineering is the process of analyzing a software binary or program to understand how it works, find bugs, or discover hidden features.
Whether you're a security researcher, a developer fixing compatibility, or a student learning low-level programming, reverse engineering gives you the tools to read the machine-level logic behind programs.
This guide covers the essentials: tools, static and dynamic analysis, basic assembly concepts, workflows, and practical examples you can try on your own. It’s written in simple language and includes code snippets so you can follow along.
Why learn reverse engineering?
Learning reverse engineering teaches you how programs behave at the CPU and OS level. That makes you a much stronger developer or security engineer.
Getting set up: tools & environment
Static analysis: read without running
Static analysis means inspecting the binary and files without executing them. It’s the safest first step.
These commands often reveal function names, embedded URLs, and text messages.
Dynamic analysis: run & observe
Dynamic analysis means executing the binary in a controlled environment and watching what it does.
Example: trace system calls with strace:
This reveals which files it accesses and if it tries to connect to remote hosts.
Basic assembly for beginners (x86/x86_64)
Here’s a tiny example of x86_64 function in assembly and what it means:
Example: disassemble bytes with Capstone (Python)
If you want to programmatically inspect machine code, use Capstone:
This prints readable assembly instructions from raw bytes - great for automation.
Finding vulnerabilities: typical patterns
Practical workflow (step-by-step)
Sample radare2 commands (fast workflow)
radare2 is powerful once you learn its commands. Use scripts to repeat analysis across many binaries.
Tips to improve your skills
Real quick practical lab you can try
Conclusion - start small, build confidence
Reverse engineering is a practical skill that rewards hands-on practice. Start with simple binaries, use safe environments, and combine static analysis with dynamic debugging. Over time you’ll be able to read decompiled code faster, spot subtle bugs, and even create automated analysis tools.

Whether you're a security researcher, a developer fixing compatibility, or a student learning low-level programming, reverse engineering gives you the tools to read the machine-level logic behind programs.
This guide covers the essentials: tools, static and dynamic analysis, basic assembly concepts, workflows, and practical examples you can try on your own. It’s written in simple language and includes code snippets so you can follow along.
Why learn reverse engineering? 
- Find vulnerabilities and patch them.
- Understand malware or unknown binaries.
- Recover lost source logic or file formats.
- Improve debugging and performance tuning skills.
Learning reverse engineering teaches you how programs behave at the CPU and OS level. That makes you a much stronger developer or security engineer.
Getting set up: tools & environment 
Common tools
- Ghidra - powerful free decompiler and disassembler.
- IDA Pro (commercial) - industry-standard disassembler.
- radare2 / rizin - open-source, scriptable reverse tools.
- objdump, strings, readelf - quick CLI inspection.
- gdb or rr - dynamic debugging and record/replay.
- Capstone and unicorn - libraries for disassembly/emulation.
Basic environment tips
- Use a VM (VirtualBox/VMware) or a container to isolate risky samples.
- Keep snapshots so you can roll back.
- Install common packages: binutils, gdb, python3, capstone, radare2.
Static analysis: read without running 
Static analysis means inspecting the binary and files without executing them. It’s the safest first step.1) Quick CLI checks
Open a terminal and run: Bash:
# list strings that might reveal messages or URLs
strings sample.bin | head -n 50

# show sections and basic info
readelf -h sample.bin
objdump -d sample.bin | less2) Use a disassembler / decompiler
Load the binary in Ghidra or radare2 to see functions, control flow graphs, and decompiled pseudo-C. Decompilers often give readable pseudo-code that speeds up understanding.3) Spot suspicious behavior
Look for:- network API calls (connect, send, recv)
- file I/O patterns (open, read, write)
- code that decrypts or unpacks content
Dynamic analysis: run & observe 
Dynamic analysis means executing the binary in a controlled environment and watching what it does.Tools & techniques
- gdb: set breakpoints, inspect memory and registers.
- strace / ltrace: trace system and library calls.
- tcpdump / Wireshark: capture network traffic.
- Sandbox the process and monitor file system changes.
Example: trace system calls with strace:
Bash:
# run binary and record syscalls
strace -f -o trace.txt ./sample.bin
# inspect trace
grep -E "open|connect|execve" trace.txt | lessBasic assembly for beginners (x86/x86_64) 
Here’s a tiny example of x86_64 function in assembly and what it means: Code:
push rbp
mov rbp, rsp
sub rsp, 0x20
mov DWORD PTR [rbp-0x4], edi
call 0x400520
leave
ret- push rbp / mov rbp, rsp - function prologue (stack frame setup).
- sub rsp, 0x20 - reserve local stack space.
- call 0x400520 - call another function.
- leave / ret - function epilogue and return.
Example: disassemble bytes with Capstone (Python) 
If you want to programmatically inspect machine code, use Capstone: Python:
from capstone import *
CODE = b"\x55\x48\x8b\x05\xb8\x13\x00\x00"
md = Cs(CS_ARCH_X86, CS_MODE_64)
for i in md.disasm(CODE, 0x1000):
print("0x%x:\t%s\t%s" %(i.address, i.mnemonic, i.op_str))Finding vulnerabilities: typical patterns 
- Unsafe string operations (e.g., strcpy, gets).
- Integer overflows or underflows.
- Unchecked memory allocations and boundary checks.
- Unvalidated input that reaches command execution APIs.
Practical workflow (step-by-step) 
- Collect intel - file type, architecture, timestamps, strings.
- Static pass - disassemble and identify main functions and libraries.
- Dynamic pass - run under debugger/sandbox, set breakpoints on suspicious functions.
- Trace inputs - feed controlled input to observe behavior.
- Automate - write scripts (Capstone, radare2 scripts) to speed repetitive tasks.
- Document - keep notes: function names, offsets, and key findings.
Sample radare2 commands (fast workflow) 
Bash:
# open file in radare2
r2 -A sample.bin
# show functions
afl
# show disassembly at a function
pdf @ main
# analyze and graph
VVTips to improve your skills 
- Start with small, known binaries (compiled from simple C programs).
- Practice on Capture The Flag (CTF) reverse challenges.
- Read write-ups and follow security blogs.
- Learn assembly for at least one architecture (x86_64 or ARM).
- Automate repetitive tasks with Python scripts + Capstone or radare2.
Real quick practical lab you can try 
- Compile a simple C program:
C:
// hello.c
#include <stdio.h>
int main(){ printf("Hello, RE world!\n"); return 0; }- Compile: gcc -o hello hello.c && strip hello
- Inspect strings: strings hello
- Disassemble: objdump -d hello | less
- Load in Ghidra or radare2 and try to match assembly to the original C.
Conclusion - start small, build confidence 
Reverse engineering is a practical skill that rewards hands-on practice. Start with simple binaries, use safe environments, and combine static analysis with dynamic debugging. Over time you’ll be able to read decompiled code faster, spot subtle bugs, and even create automated analysis tools.
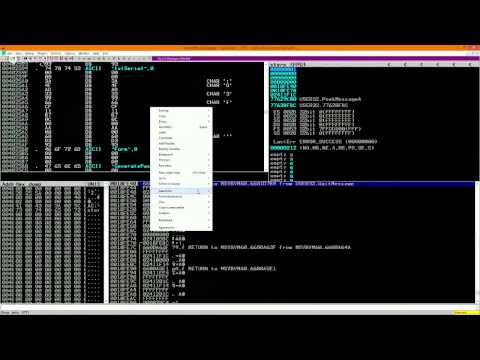
👆 Click The Image To Watch The Video 👆
Last edited: